
Infographics can make a powerful statement, but I've never done a successful infographics lesson until I discovered the EduProtocol: Number Mania! from the book The EduProtocol Field Guide Book 2: 12 New Lesson Frames for Even More ...
Book by Jon Corippo and Marlena Hebern. The concept is deceptively simple: Crowd source statistics on a particular topic, front load some images from the noun project on a Google slide as a template and magically (seriously it's magical) the students create their first infographic!
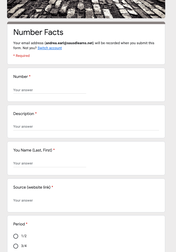
The topic I choose was COFFEE. I wanted the content to be high interest, fun, and not content dependent. I gave students 3 number rich websites and a form. Each student found 1 number and description. It only took 12 minutes (including computer boot-up and shut down.) Since I teach 3 period s of the same course, I revised my directions after the first class to include reminding students not to include the number in the description and to summarize the description, not just copy paste. The input from the 2nd and 3rd groups was much better than that from the first.
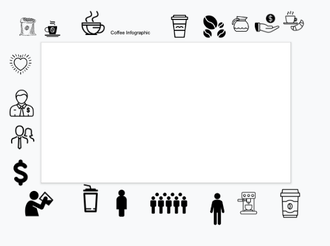
The next day, I gave students access to a Google slide template with images related to coffee. They had 15 minutes to create a one slide presentation/ "poster" with 5 facts and 5 images. The results were amazing! Check out the examples below.
For the 2nd infographic, the topic I am using is the IDITAROD (I'll talk more about how I use this event as an overarching theme in my classroom in a later post.) Again, students will be crowd sourcing the data and creating individual slides. Before I turn the students loose, however, it is important for them to analyze their Coffee infographic.
The 3rd Infographic will be about our school, to share with the community.
Finally, each group will create an infographic to support their Symposium projects. Mendez Symposium is a schoolwide program where student groups research a topic of their choosing, make connections (using the GATE icons) and present their findings to the community members. This year, each group will include an infographic to support their project.
Book by Jon Corippo and Marlena Hebern. The concept is deceptively simple: Crowd source statistics on a particular topic, front load some images from the noun project on a Google slide as a template and magically (seriously it's magical) the students create their first infographic!
The topic I choose was COFFEE. I wanted the content to be high interest, fun, and not content dependent. I gave students 3 number rich websites and a form. Each student found 1 number and description. It only took 12 minutes (including computer boot-up and shut down.) Since I teach 3 period s of the same course, I revised my directions after the first class to include reminding students not to include the number in the description and to summarize the description, not just copy paste. The input from the 2nd and 3rd groups was much better than that from the first.
The next day, I gave students access to a Google slide template with images related to coffee. They had 15 minutes to create a one slide presentation/ "poster" with 5 facts and 5 images. The results were amazing! Check out the examples below.
For the 2nd infographic, the topic I am using is the IDITAROD (I'll talk more about how I use this event as an overarching theme in my classroom in a later post.) Again, students will be crowd sourcing the data and creating individual slides. Before I turn the students loose, however, it is important for them to analyze their Coffee infographic.
The 3rd Infographic will be about our school, to share with the community.
Finally, each group will create an infographic to support their Symposium projects. Mendez Symposium is a schoolwide program where student groups research a topic of their choosing, make connections (using the GATE icons) and present their findings to the community members. This year, each group will include an infographic to support their project.
|
|
